These Charts Say a Financial Crisis Could Be Ahead
There are some weird/odd/uncanny things happening in the financial world these days. Each one is as scary as the other, but all of them continue to get underreported or simply overlooked. They hint that a financial crisis could be nearing.
There are three developments in particular that could be worth watching closely.
Advertisement

First, see the chart below. It plots the difference between the yields on two-year U.S. treasury bonds and the yields on 10-year U.S. treasury bonds. Economists refer to this as a yield curve.
Usually, economists use the yield curve to check the pulse of the economy. If the yield curve is inverted, it hints that a recession is ahead. Yield curve has acted as a powerful indicator for some time now. It has predicted all the previous recessions in the U.S. economy.
Currently, the yield curve is inverted. This means the yields on long-term U.S. bonds are lower than the yields on short-term bonds.
Here’s the kicker: at the time of this writing, the yield curve has been inverted for about 90 weeks. This is the longest time it has been inverted in recent history!
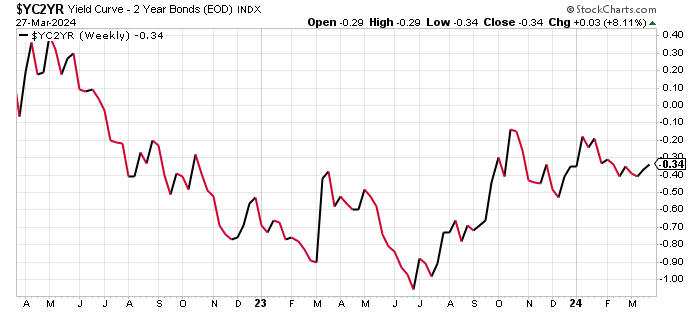
Chart courtesy of StockCharts.com
The question now becomes: What is the yield curve saying? As mentioned earlier, an inverted curve says a recession could be ahead, but is it also saying the next economic slowdown in the U.S. economy could be severe?
An inverted yield curve creates a big headache for the financial world. For instance, how does a bank set its interest rates on loans for businesses and consumers when there’s an inverted yield curve? The yield curve tends to be inverted before a financial crisis.
Investors Aren’t Fearful These Days
Second, take a look at the Chicago Board Options Exchange (CBOE) Volatility Index (VIX) chart below. The VIX is often referred to as the “fear index.”
VIX 101: When the fear index is below 20, it’s a sign that investors are optimistic, and they happen to own stocks. When the index is above 20, it means investors are getting nervous. When the VIX is above 30, it means panic is kicking in. When it’s above 40, it usually means there’s a lot of fear and uncertainty.
Currently, the VIX stands around 12. It’s saying that investors are loving stocks.
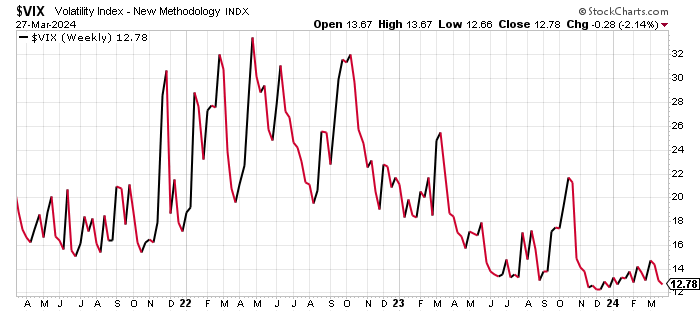
Chart courtesy of StockCharts.com
Now, here’s the really strange part: investors are super-positive about stocks even though valuations are extremely high compared to historical averages, the global economy is struggling, inflation remains sticky, and the list goes on.
Generally, prior to a financial crisis, you see investors being euphoric and having the idea that nothing can go wrong.
No Financial Stress in the Markets
Third, take a look at the St. Louis Fed Financial Stress Index. As its name suggests, it tells us what the stress level is in the financial system. This index is built using 18 weekly data series that include seven interest rate series, six yield spreads, and five other indicators.
How to read the St. Louis Fed Financial Stress Index? A value of zero is considered normal financial conditions. Values below zero indicate below-average financial market stress. Values above zero mean above-average financial market stress.
As it stands, this index is at -0.9347, indicating below-average financial market stress.
What’s uncanny here is that the yield curve is inverted, there’s still uncertainty around interest rates, and some economic indicators are starting to suggest that the U.S. economy could be slowing.
Also worth noting: the last time the St. Louis Fed Financial Stress Index was consistently below -0.90 was in the 2006–2007 period. We all know what followed a few quarters later. Could this pattern repeat itself again? It’s possible.
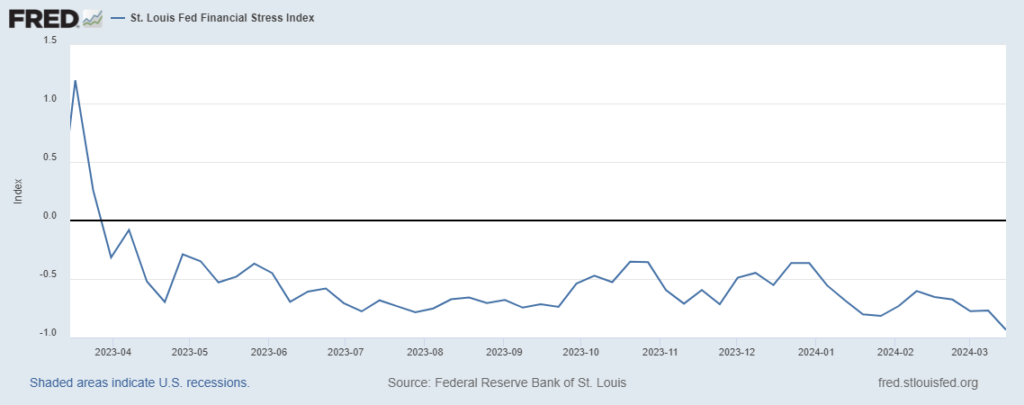
(Source: “St. Louis Fed Financial Stress Index,” Federal Reserve Bank of St. Louis, last accessed March 27, 2024.)
Don’t Do This During a Financial Crisis
Dear reader, investors may be too busy at the moment listening to all the noise about artificial intelligence (AI) stocks and cryptocurrency exchange traded funds (ETFs). However, the three factors I pointed at earlier are troubling.
I have to wonder if a financial crisis is just around the corner and we’re seeing the calm before the storm.
I fully understand that, at a time when optimism prevails and everything looks good, it’s hard to talk about anything pessimistic. But I can’t stress this enough: don’t get too complacent. This calm is scary.
If a financial crisis does happen, we could be in for a rude awakening. No one is expecting it, but if it happens, there’s no way that investors will remain rosy. We could end up seeing significant selling across the financial world.